Another Sunday afternoon, another thought of curiosity running through my mind. This time it turned into a slightly larger Claude Cowork project, one I'd like all of you to be able to use. So I built it into a little tool that lives on this site.
Have you ever wondered what's actually better: owning your own home, or putting the same money into the S&P 500?
It sounds like a simple question. It isn't. And depending on whose advice you read, you'll get a completely different answer.
Three schools of thought
There's the world I grew up in, where the received wisdom was straightforward: rent is money you'll never see again, get on the ladder as soon as you can, a house is the best investment you'll ever make. An Englishman's home is his castle.
Then there's the more modern, finance-Twitter view, Ramit Sethi is probably its loudest voice, which argues almost the opposite. His position, broadly, is that a home is a lifestyle purchase dressed up as an investment; that once you tally the deposit, the interest, the maintenance, the property taxes and the transaction costs, renting and investing the difference often leaves you wealthier. He rents by choice, and he's done the spreadsheets to back it up.
And then there's a third camp altogether, the property investors, who'd tell you to forget your own home and buy a rental instead, because leverage and rental income are how real wealth gets built.
Three confident, contradictory answers. So how do you actually work out which is right for you?
Well, I built a calculator.
How it works
The honest answer to "which is better" is it depends on the numbers you put in — so the tool lets you put in your own. You set the purchase price, the deposit, the mortgage rate, the rent, the running costs, your tax position and how long you hold. It then runs the same money two ways and shows you where you'd land.
It compares like with like. Both sides start from exactly the same cash — deposit plus closing costs — both are measured after tax and after selling costs, and the property side reinvests its spare cash flow (if there is any) at the same market return. As best as I can make out, this makes it a genuinely fair fight. Although if I have messed up the maths, please do point it out to me.
If not owning your own home is a good idea, the natural next question is: why own property at all? If it's such a pain in the backside, why does anybody do it? So I built the same engine for that question too. A single toggle flips the whole thing between owner-occupied (your home versus renting and investing) and rental investment (a buy-to-let versus the index). Same rigour, two different decisions.
And while I'm able to make the modern version of a fancy spreadsheet, I still haven't worked out how to predict the future. So there's a Monte Carlo mode that runs a thousand random futures and tells you not just who wins, but how often.
Let me walk through a few scenarios — because the interesting part is how easily the answer flips.
When the index wins
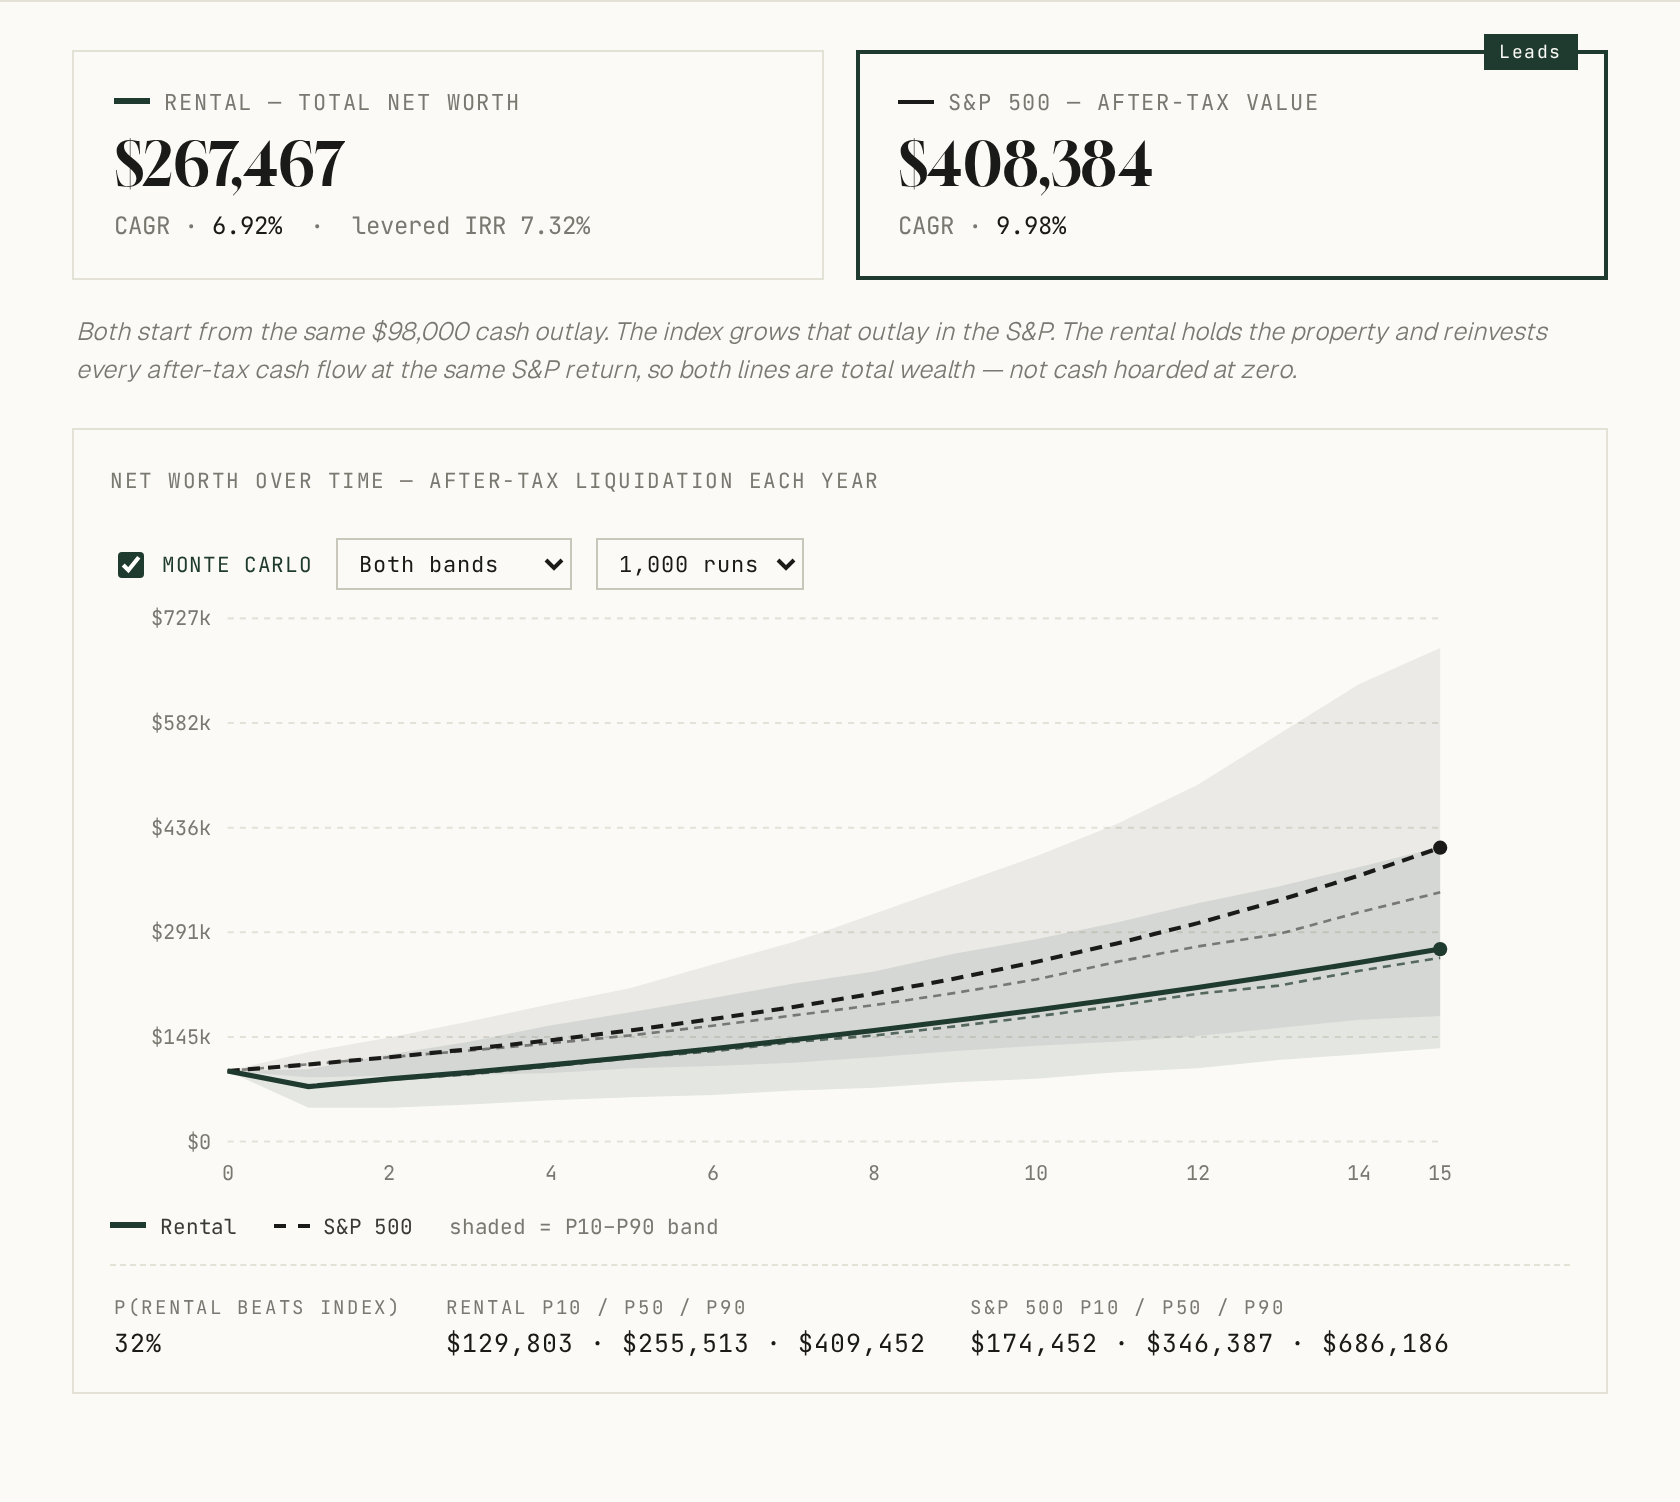
Start with the rental-versus-index mode and reasonably average assumptions: a $350,000 property, 25% down, $2,400 a month in rent, modest 4% appreciation, and the S&P doing what it's done for the last twenty years — about 11% a year with dividends.
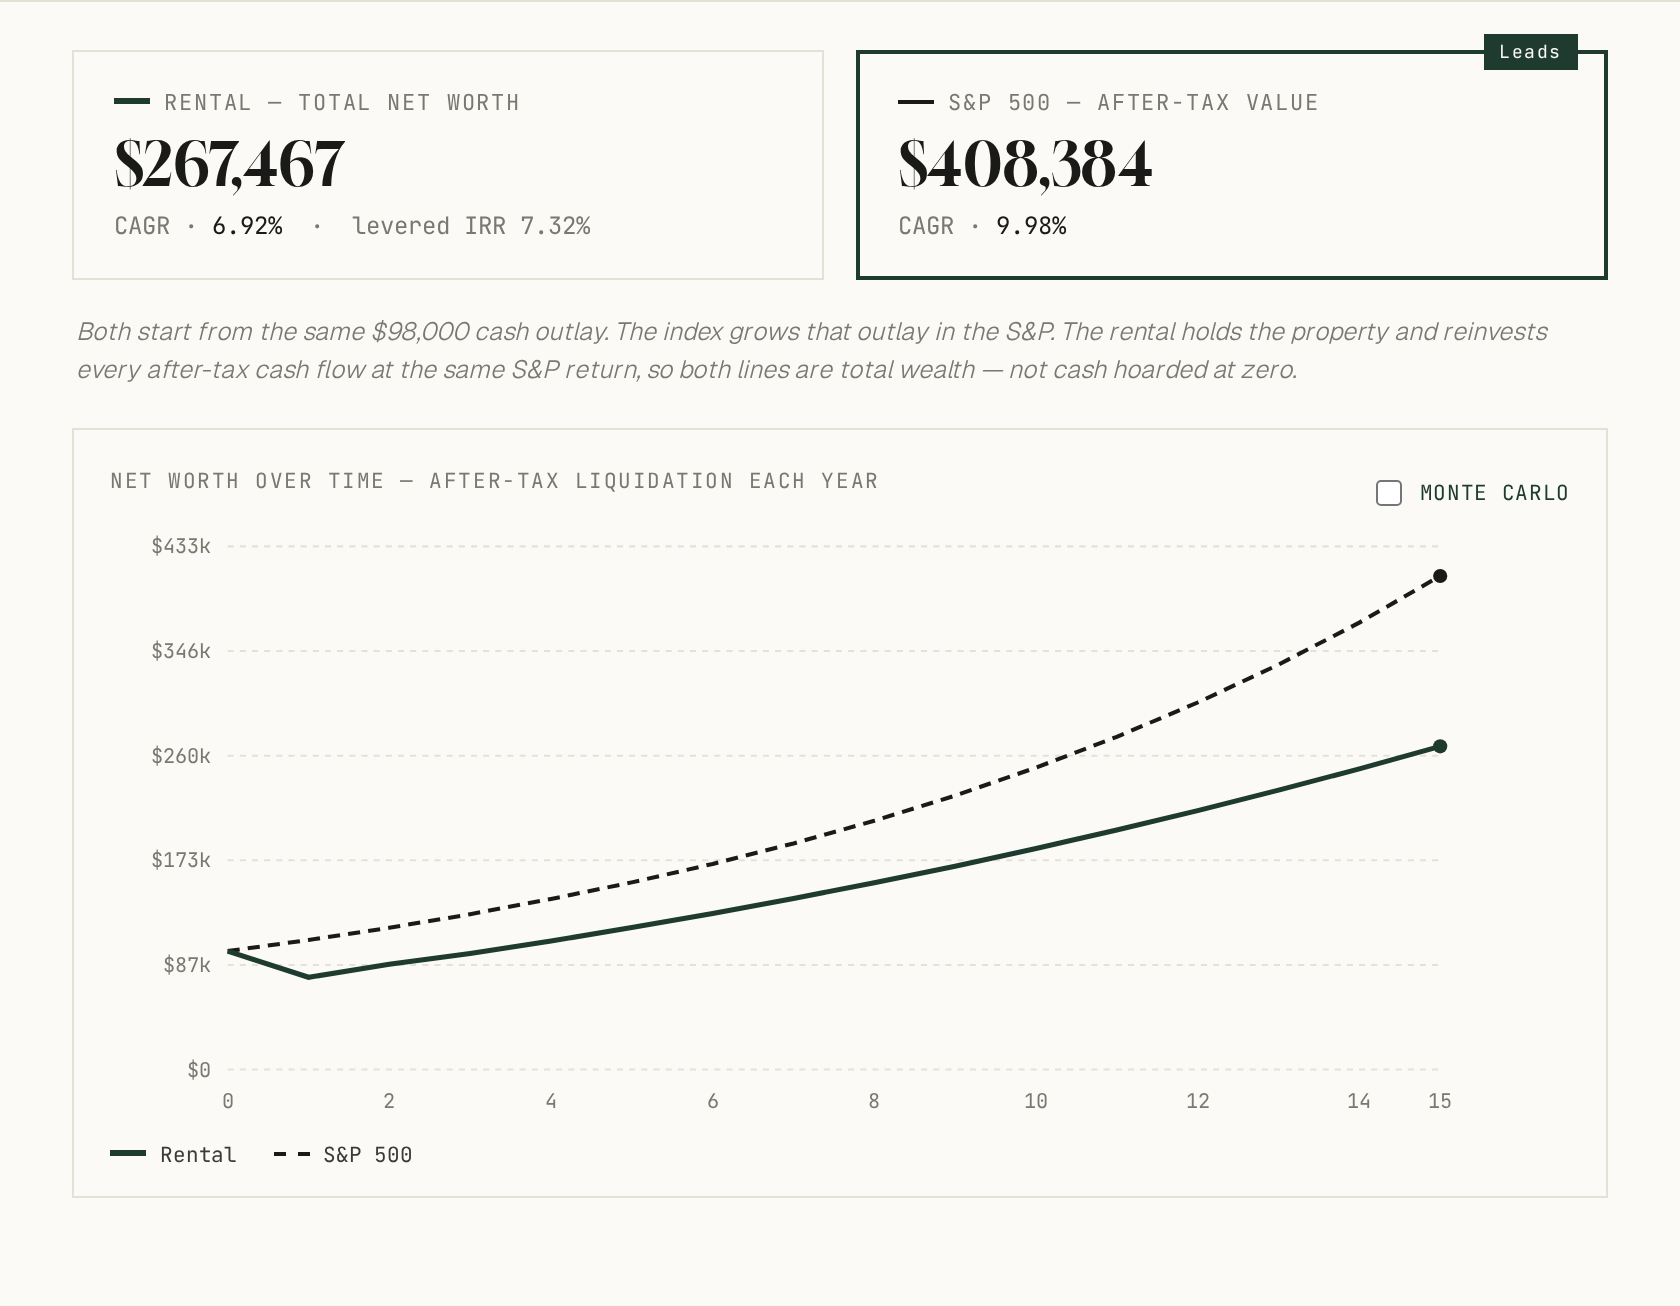
The index wins, and it isn't close — $408,000 against $267,000. This is the property investor's uncomfortable truth: a perfectly ordinary rental, bought at an ordinary price, competing against a roaring stock market, loses. Notice too that the rental line actually dips in year one — that's about the 7% you'd lose to selling costs if you bailed out early. Property is not cash; you have to sell the house to get at it, and the tool won't let you forget it.
When the bricks win
But change the deal, not just the market. Suppose you found a genuinely high-yield property — $3,400 a month on the same $350,000, a stronger 5% appreciation — and suppose the next fifteen years for equities are flatter, say 8% rather than 11%.
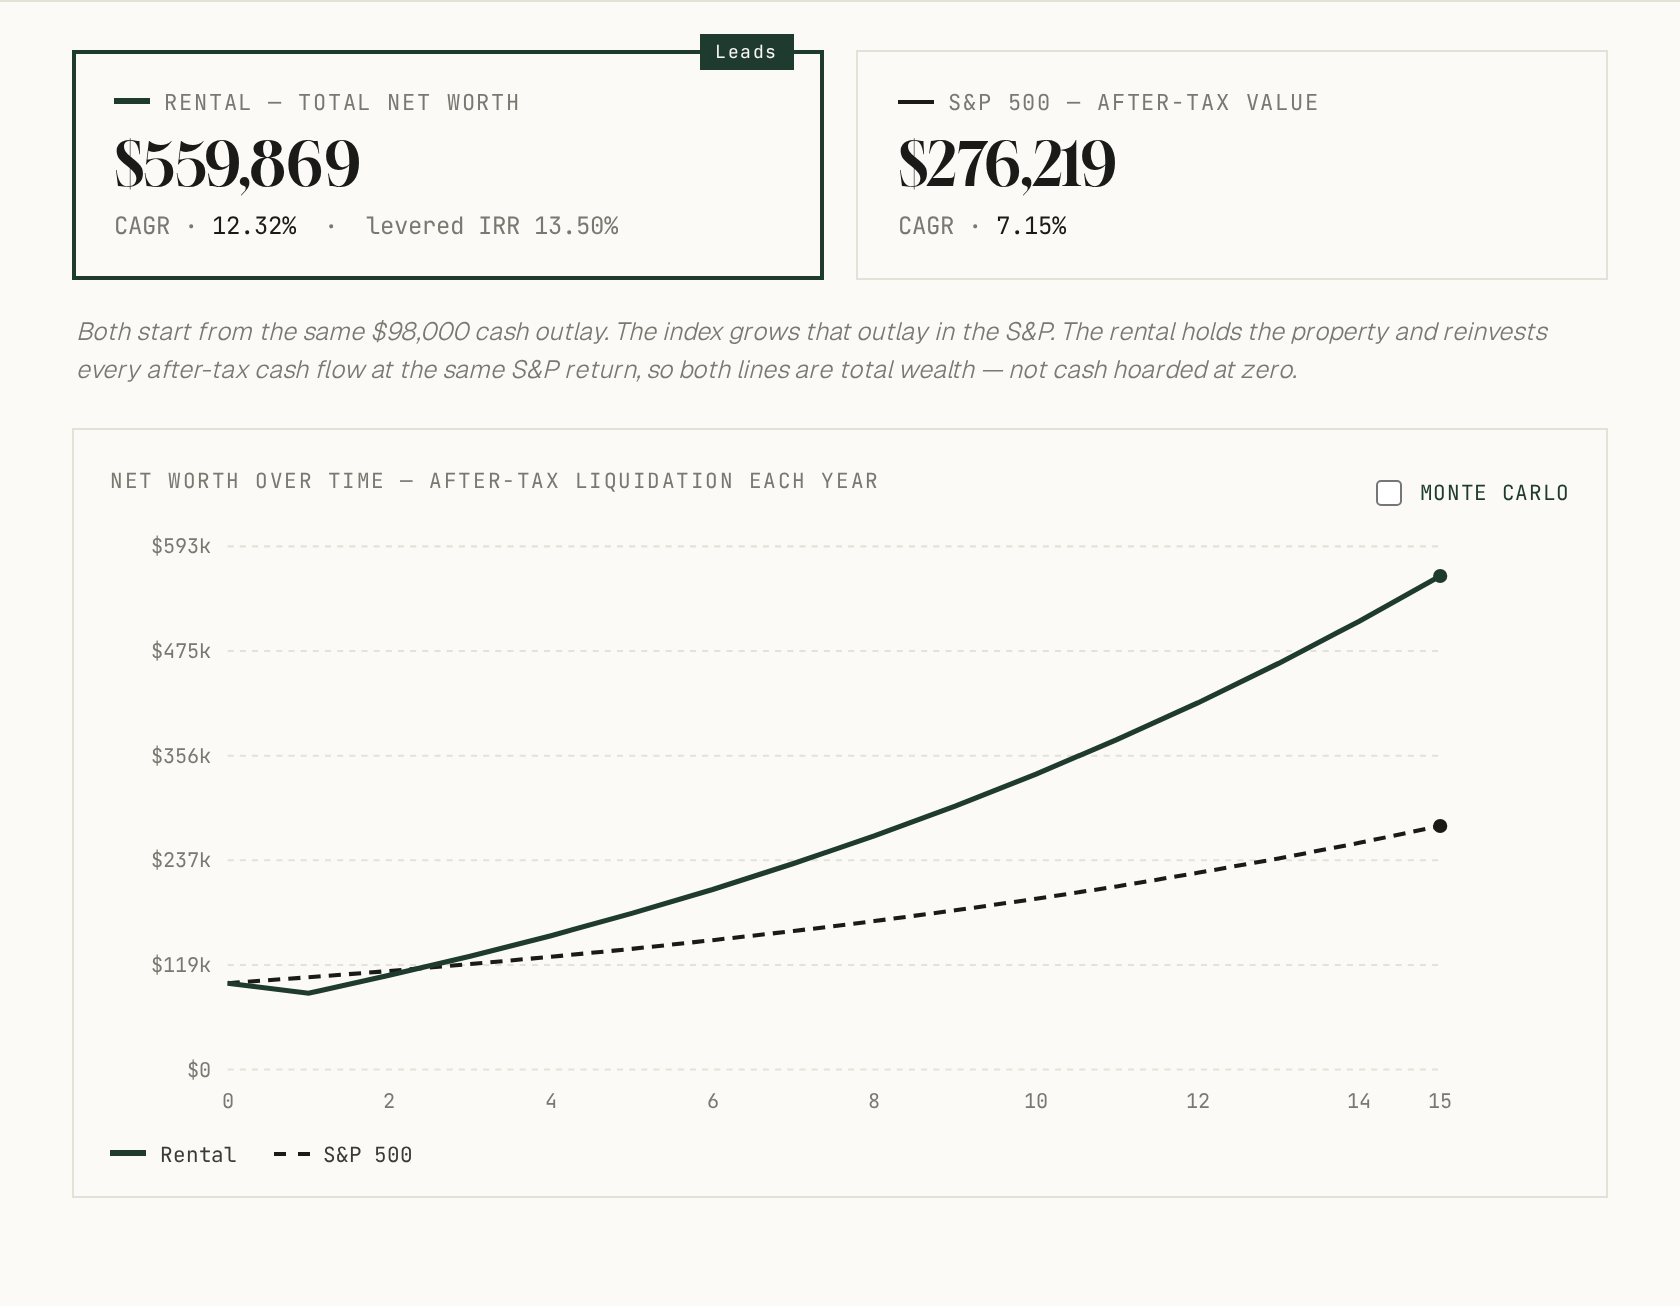
Now the bricks win, and handsomely — $560,000 against $276,000. This is leverage doing its work: you control a $350,000 asset with $98,000 of your own money, so when the rent covers the costs and the asset appreciates, your equity compounds far faster than the headline appreciation rate. The whole argument, really, comes down to two things you can't know in advance: how good a deal you find, and what the market does next.
Now your own home
Flip the toggle to owner-occupied. The question changes from "is this a good investment?" to "should I buy the place I live in, or rent it and invest the difference?"
Here's the case for buying. Imagine rent in your area is expensive — $2,800 a month to rent the equivalent home — appreciation is a healthy 5%, the market is doing a steady 8%, and you stay put for twenty years.
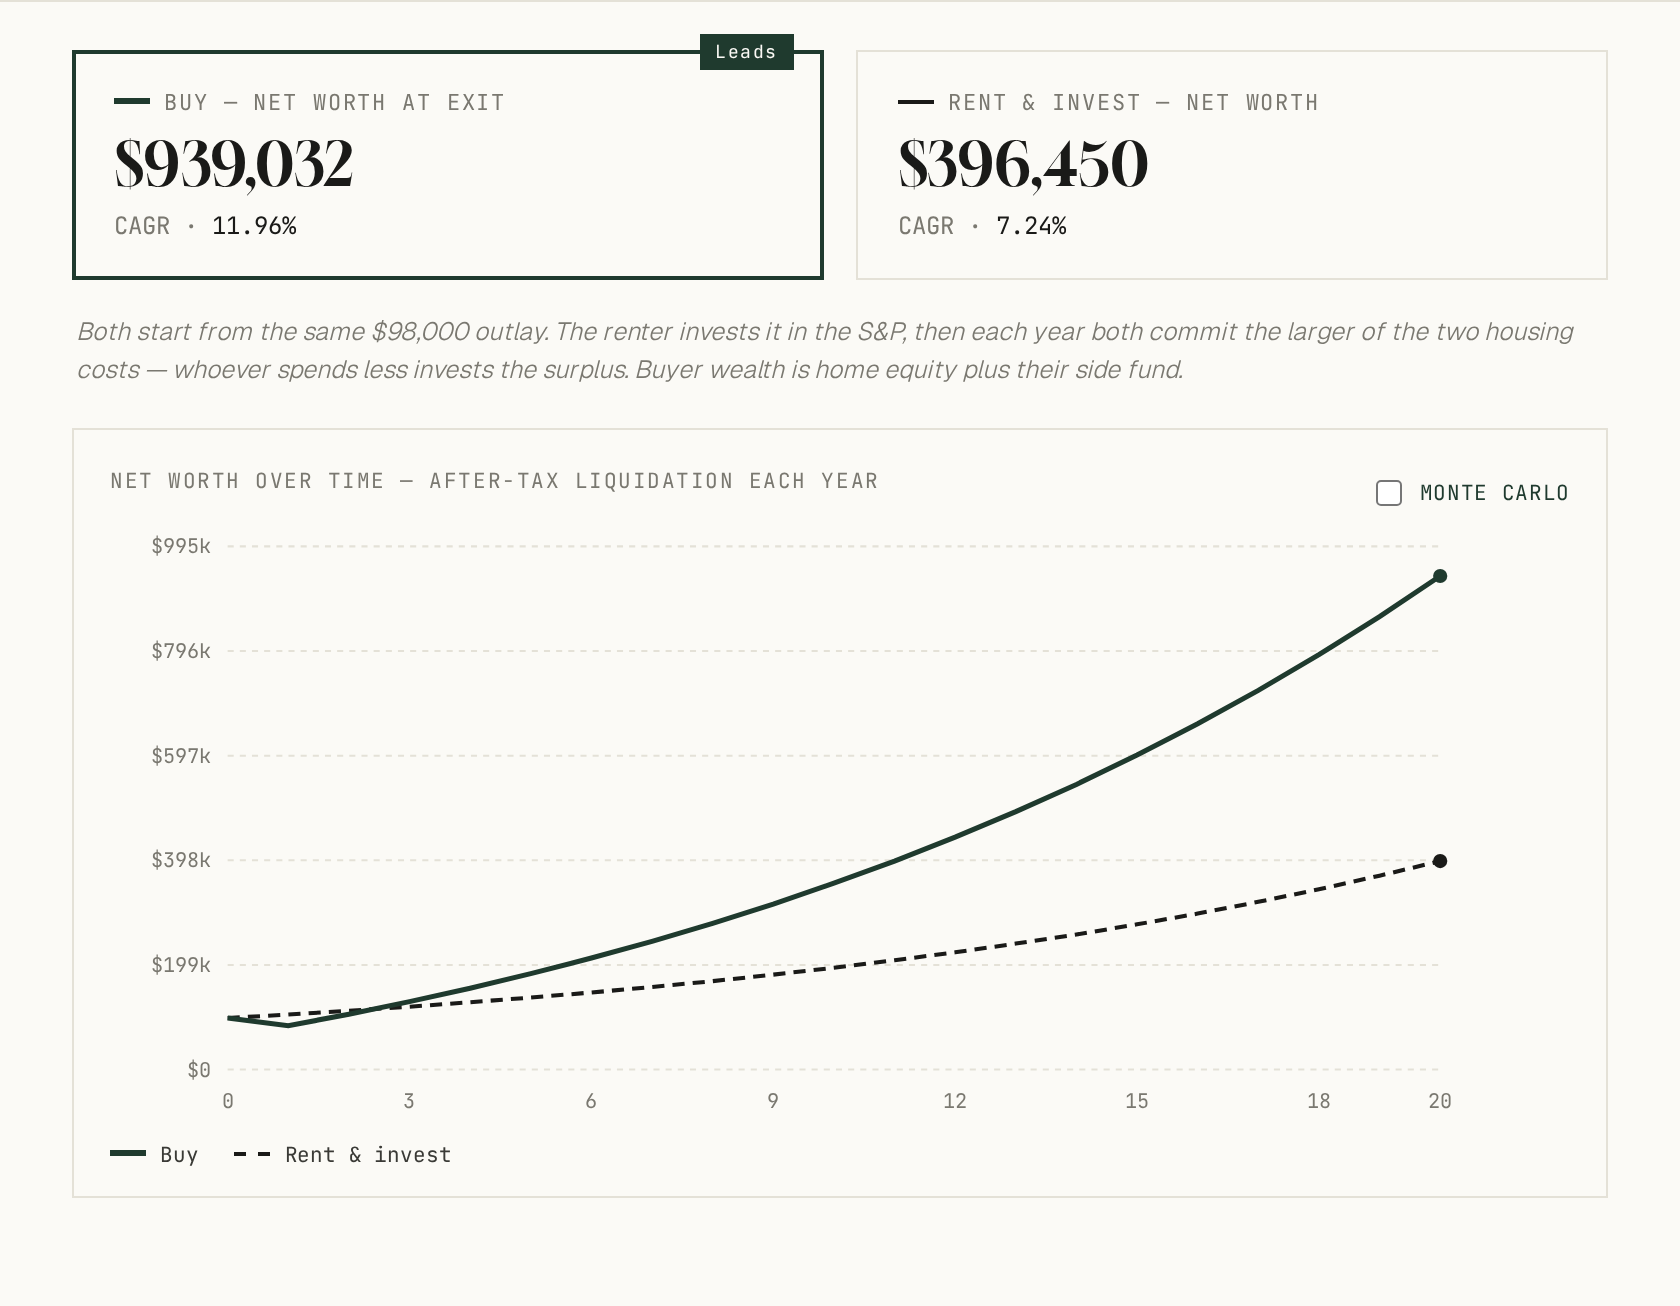
Buying wins by a mile — $939,000 against $396,000. When renting is dear and you stay put, ownership is essentially a forced-savings plan with leverage and a tax-free gain at the end (the §121 exclusion shields the first $250,000–$500,000 of profit). Every month you're paying down a mortgage instead of a landlord, and after two decades that compounds into real money.
And the case against
But shift the inputs to where Ramit Sethi tends to argue from. Suppose rent is cheap relative to buying — $1,600 a month — appreciation is a sluggish 3%, and the stock market is back to its strong 11%.
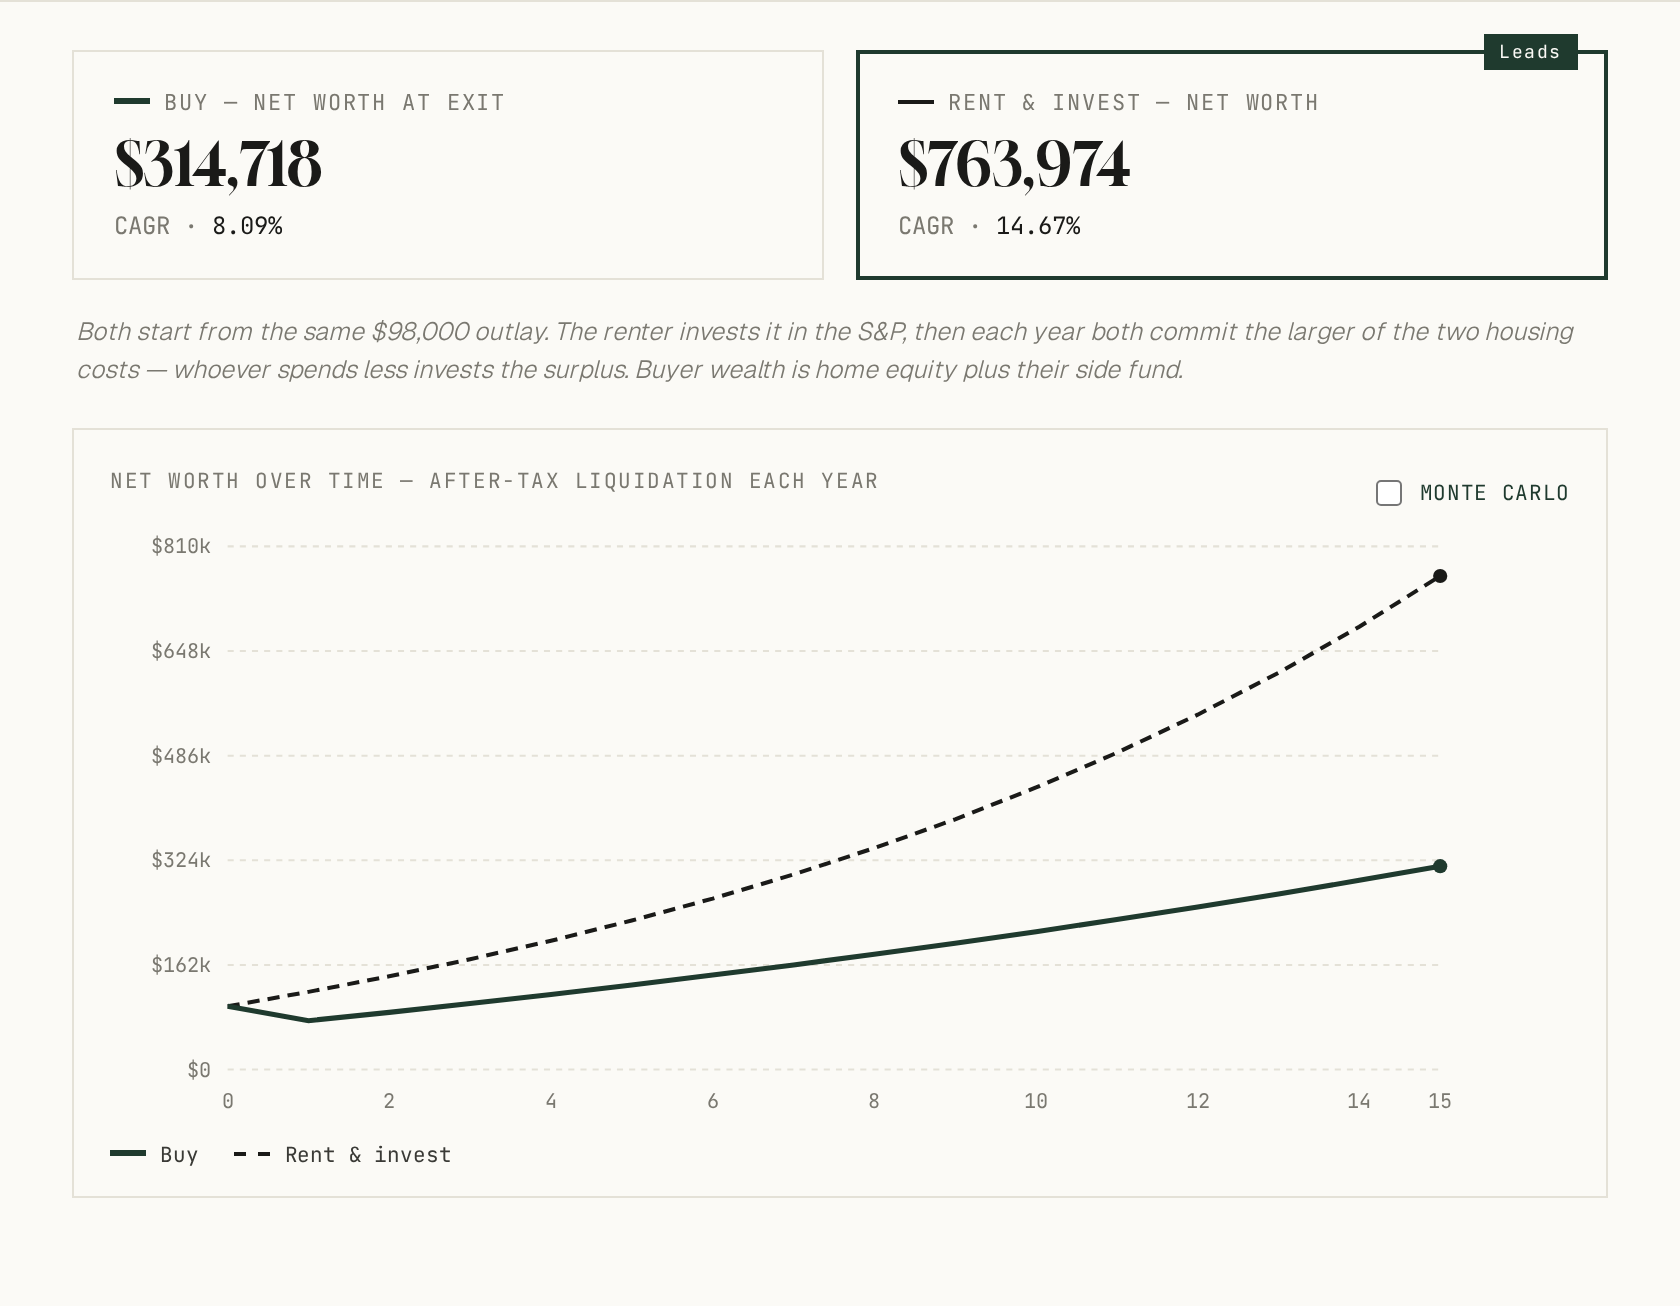
Now renting and investing the difference wins, and it's not subtle — $764,000 against $315,000. When rent is a bargain, the money you don't sink into a deposit and a mortgage goes to work in the market instead, and over fifteen years that gap becomes enormous. This is the steelman of the rent-and-invest case, and the tool shows it's a perfectly real outcome — not heresy.
Nobody knows the future
Here's the catch with all four of those charts: every one of them assumes you know what appreciation and the market will do. You don't. So switch on Monte Carlo, and instead of one tidy line the tool runs a thousand random futures and shades the range of outcomes.
On those average assumptions, the rental beats the index in only about a third of simulated futures. That single number — how often, not just whether — is, to me, the most honest output the whole thing produces. It turns a confident-sounding answer back into a probability, which is what it always really was.
So who's right?
All of them, and none of them. That's rather the point.
Run enough scenarios and you realise the "right" answer was never living in the maths. The maths just tells you the price of each choice. At the end of the day, it comes down to preference.
I grew up in an environment where owning your own home was deeply preferential, and I put real stock in that, the stability, the sense that the place is yours, the freedom to knock a wall through without asking anyone. Other people, entirely reasonably, put their stock in flexibility: being able to take a new job in a new city, to move across town on a month's notice, to never once think about the boiler or the roof or the sprinkler system.
Which brings me back to that Sunday afternoon and its coffee. I should confess that I wrote most of this the day after I spent the whole of Saturday up to my knees in mud in the back garden, fixing a broken sprinkler system (only somewhat enjoying myself). So take my even-handed conclusion in that spirit. The numbers can tell you which choice is likely to make you wealthier. They can't tell you how much you'll enjoy the mud.
Try it yourself
Here's the tool itself — the very same one I used for every chart above. Flip between owning your home and buying a rental, push the assumptions around, switch on Monte Carlo, and see which way it lands for your numbers. You can also open it in its own page to run it full-screen or share it directly.
This is not financial advice, and I'm not predicting where any market is heading. It's a model — and a model is only ever as good as the assumptions you feed it. Go and feed it your own.